Hackathon Gamification: A Real-Time Leaderboard You Can Deploy in 5 Minutes
![]() written by Stefan Christoph
written by Stefan Christoph
Lisbon, 6 AM, Rising Sun

Lisbon at dawn — the best way to start a hackathon day
Three days in Lisbon. Not for sightseeing, though the city makes that hard to resist. I’m here for an AI hackathon — teams building an AI-driven radio station from scratch. The kind of challenge where you start with nothing and ship something that plays audio by the end.
My morning run takes me along the waterfront as the sun comes up over the Tagus. There’s something about running in a foreign city at dawn that resets your brain. By the time I’m back, I’m ready for what’s coming.
Finding Your Team, Finding Your Voice
The morning starts with a short inspiration talk — not about service capabilities (we covered that earlier, leveraging the rich collection of hands-on workshops at workshops.aws [7]). Instead, it’s about what’s possible when you start exactly where these teams are starting today. The DFL, for example, began their AI journey a few years ago much like the folks gathered in this room — experimenting, iterating, figuring out what works. Today they’re generating real-time match insights from 200 million data points per game and using generative AI to transform content production across the Bundesliga [8][9]. The message: the distance between “hackathon experiment” and “production innovation” is shorter than you think.
Then the real work begins. If you’ve been to a hackathon, you know the phase: finding your teammates, aligning on a shared vision, establishing common ground. People who didn’t know each other an hour ago are standing at flipboards, sketching architecture diagrams, debating whether to use streaming or batch inference, negotiating prompt strategies. It’s messy and productive at the same time.
By midday — half a day in — the first AI-generated audio hits the speaker in the room. Someone’s pipeline works end-to-end. The room erupts. That moment, when something goes from whiteboard sketch to working prototype in hours, never gets old.
The Question Nobody Asked
The hackathon’s goal is clear: build an AI radio station. But the real purpose of any hackathon isn’t the final product. It’s the learning. People step outside their daily roles, pick up tools they’ve never used, make mistakes in a safe environment, and walk away with skills they didn’t have three days ago. The radio station is the vehicle. The growth is the destination.
There’s a secondary goal that nobody stated explicitly. We want teams to use AI aggressively. Not just for the final product, but for the building process itself. Use it as a soundboard for ideas. Use it to prototype, throw away, iterate. Use it to get unstuck. Learn by doing, not by reading documentation.
The problem: how do you know if teams are actually doing that? How do you see who’s hacking hardest, who’s iterating fastest, who’s burning through ideas at the rate that produces breakthroughs?
Token consumption. The answer is token consumption.
If a team is consuming tokens at a high rate, they’re doing something right. They’re prompting, generating, evaluating, discarding, trying again. They’re using AI the way it should be used in a hackathon: as an accelerant for experimentation.
Is it a perfect metric? No. A team stuck in a retry loop with a broken prompt burns tokens without progress. But in a 3-day hackathon, the correlation between iteration velocity and output is stronger than you’d think. Teams that stop iterating stop shipping. Token consumption is a leading indicator, not a quality judgment.
Pastéis de Nata and Python
The idea hits me during a coffee break. I’m sitting in one of those Portuguese coffee bars where the pastéis de nata are still warm and the espresso is strong enough to restart a stopped heart. For the uninitiated: pastéis de nata are custard tarts invented by monks at the Jerónimos Monastery in Belém, who had egg yolks left over from starching their habits with egg whites [6]. Centuries later, they’re still the best companion for a coding session. What if we had a leaderboard? Real-time. Showing which team is consuming the most tokens. A scoreboard for AI usage itself.
I open Kiro and start vibe-coding.
The approach is simple: each team has their own AWS account. Amazon Bedrock publishes InputTokenCount and OutputTokenCount metrics to CloudWatch automatically — no setup required on the team’s side. I just need to poll those metrics, calculate costs using per-model pricing, and serve a dashboard.

The leaderboard polls CloudWatch metrics from each team’s account every 60 seconds
The key insight: CloudWatch metrics appear within about 5 minutes of the API call. That’s dramatically better than Cost Explorer’s 24-hour delay or Cost and Usage Reports that land in S3 once daily. For a hackathon, 5 minutes is close enough to real-time. And the best part: Bedrock publishes these metrics automatically. Zero setup required in the team accounts.
The Build
One Python script. No frameworks, no databases, no infrastructure beyond a laptop. The script:
- Reads a config file with team account IDs and AWS CLI profiles
- Polls CloudWatch
GetMetricStatisticsfor each team’s Bedrock usage - Calculates costs using per-model pricing (auto-detected via
setup-pricing.py) - Serves an HTML dashboard that auto-refreshes
I tested it with colleagues, generated some synthetic invocations to verify the numbers, and pushed it to GitHub within the same coffee break. A hackathon inside a hackathon.
The whole thing is self-contained. No Lambda functions, no DynamoDB tables, no CloudFormation stacks. Just pip install boto3 and run. Because when you’re at a hackathon, the last thing you want is to spend an hour deploying infrastructure for your meta-tool.
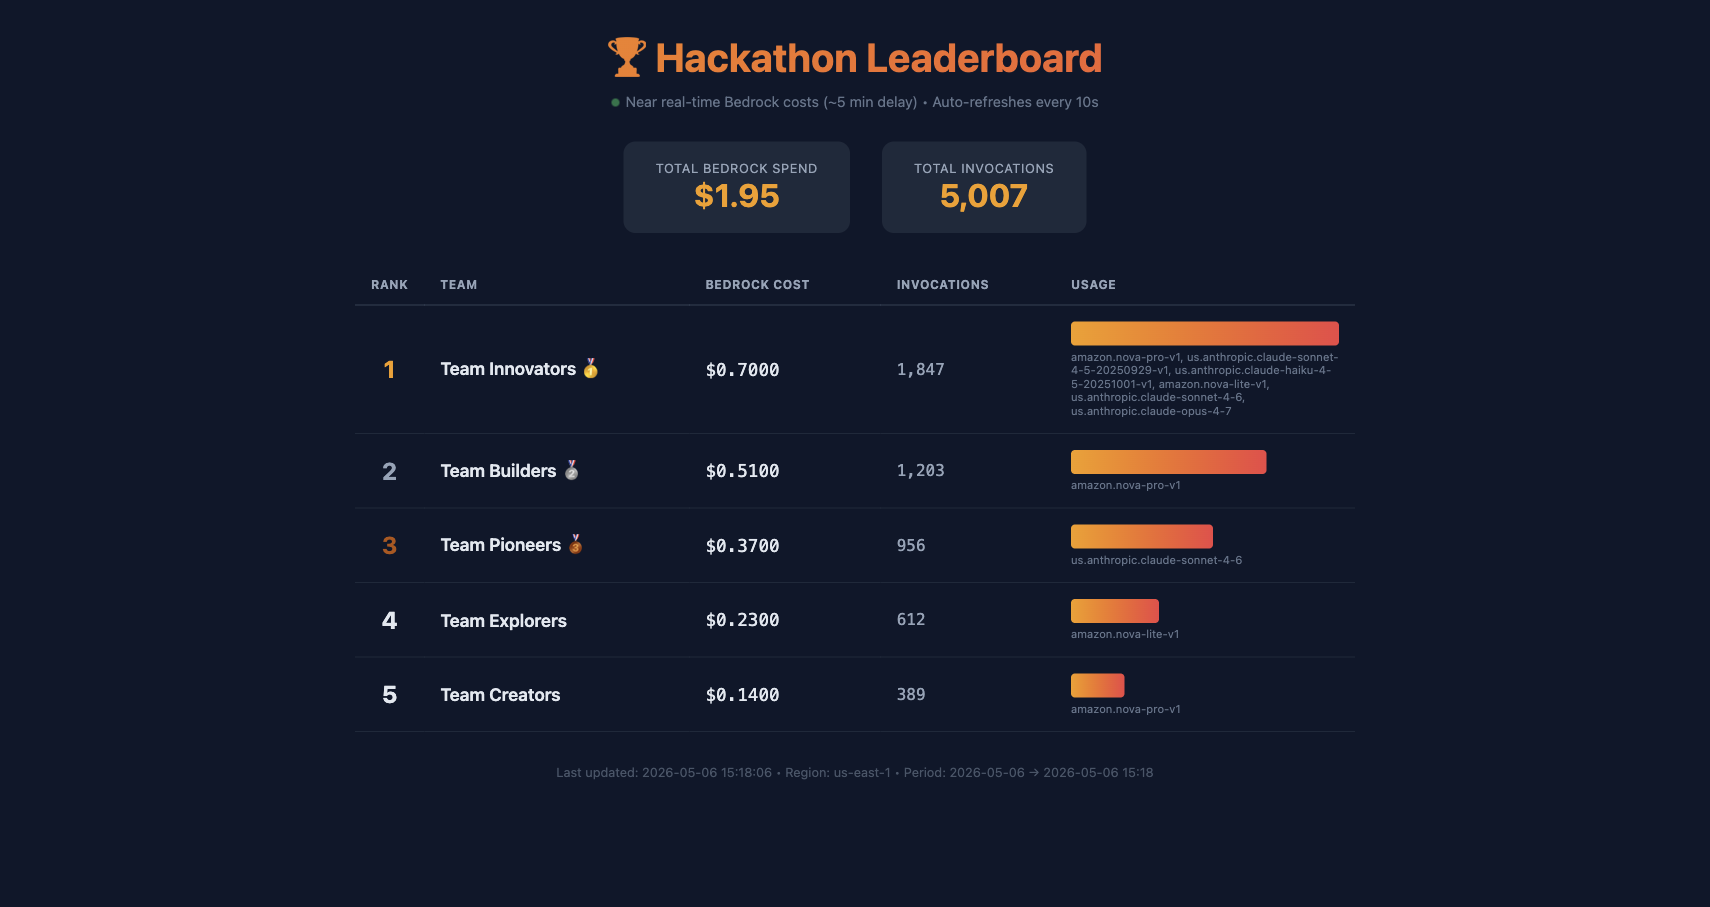
The leaderboard in action — teams ranked by Bedrock token consumption
What Kiro Built
I want to be specific about what “vibe-coded with Kiro” means here. I described what I wanted in natural language: poll CloudWatch metrics from multiple accounts, calculate costs, serve a dashboard. Kiro produced the implementation. I reviewed, tested, iterated.
The result is about 400 lines of Python that handles:
- Multi-account credential management via AWS CLI profiles
- Region-aware pricing with automatic model discovery
- Graceful handling of expired SSO tokens (shows $0 with an error, doesn’t crash)
- A clean HTML dashboard with auto-refresh
- A test script that generates real Bedrock invocations for verification
Could I have written this from scratch? Yes. Would it have taken one coffee break? No. The agent handled the boilerplate — the CloudWatch API pagination, the HTML template, the argument parsing — while I focused on the design decisions: which metrics to use, how to handle pricing fallbacks, what the dashboard should show.
This is the pattern I keep writing about [1][2]. The agent doesn’t replace the architect. It replaces the typing.
The Leaderboard Effect
Something interesting happened when we projected the leaderboard on the wall. Teams started competing. Not on the final product — that competition was already there. They started competing on token consumption. On experimentation velocity.
This isn’t surprising if you look at the research. Gamification studies consistently show that leaderboards work because they make progress visible [4]. The fundamental problem in any hackathon is the gap between effort and feedback — a team works for hours and the only signal they get is from their own progress. Are they ahead? Behind? On the right track? A visible leaderboard closes that gap [5].
A team that was stuck on a prompt design problem saw their bar flatline on the leaderboard. That visual signal — “you’ve stopped iterating” — was enough to unstick them. They tried a different approach, tokens started flowing again, and twenty minutes later they had a working solution.
The leaderboard didn’t measure quality. It measured activity. And in a hackathon, activity correlates with progress more than you’d expect. The teams that ship are the teams that iterate. The teams that iterate are the teams that consume tokens.
A caveat: gamification research shows mixed effects depending on position — teams near the top get energized, teams far behind can disengage [4]. In our case, measuring activity rather than quality helped. Even a team with a simple approach could rank high if they were iterating fast. For longer events, you might want to hide exact differentials and show rank only.
The Meta Observation
There’s something recursive about this that I find satisfying. A hackathon designed to get teams building with AI. Inside that hackathon, a tool built with AI (Kiro) to measure how much AI the teams are using. A hackathon inside a hackathon.
The leaderboard itself is a tiny project. A few hundred lines of Python, a config file, a setup script. But it solved a real problem in real-time: making AI consumption visible, turning an invisible metric into a social signal, and giving teams a reason to push harder.
Try It Yourself
The code is open source: github.com/stechr/bedrock-hackathon-leaderboard [3].
If you’re running an AI hackathon with Bedrock, you need:
- Python 3.8+ and boto3
- AWS CLI profiles configured for each team’s account
cloudwatch:ListMetricsandcloudwatch:GetMetricStatisticspermissions in each account
That’s it. No infrastructure to deploy. Run setup-pricing.py to auto-detect models and pricing, then hackathon-leaderboard.py to start the dashboard. Five minutes from clone to leaderboard.
What I’d Add Next
The current version is deliberately minimal — it solved the problem for this hackathon. But a few additions would make it more useful for longer events:
- Historical charts — show token consumption over time, not just totals
- Model breakdown — which models each team is using (are they exploring or stuck on one?)
- Cost alerts — notify when a team approaches a budget threshold
- GitHub Pages deployment — a static version updated via GitHub Actions for remote viewing
Some of these are already in progress. The beauty of a simple codebase is that extending it is fast — especially when you have an AI agent to help.
Have you run a hackathon where measuring AI usage would have been useful? I’d love to hear what metrics you’d track beyond token consumption.
Sources
[1] S. Christoph, “On the Loop, Not In It — But Code Quality Still Matters,” schristoph.online, March 2026. https://schristoph.online/blog/on-the-loop-code-quality/
[2] S. Christoph, “The Coding Agent That Doesn’t Code,” schristoph.online, March 2026. https://schristoph.online/blog/the-coding-agent-that-doesnt-code/
[3] S. Christoph, “Bedrock Hackathon Leaderboard,” GitHub, May 2026. https://github.com/stechr/bedrock-hackathon-leaderboard
[4] Groening & Binnewies, “How leaderboard positions shape our motivation: the impact of competence satisfaction and competence frustration,” Internet Research, 2023. https://www.emerald.com/insight/content/doi/10.1108/intr-12-2021-0897/full/html
[5] Rise Global, “How to Run a Hackathon with Points, Badges, and Leaderboards,” September 2025. https://rise.global/2025/09/15/how-to-run-hackathon-points-badges-leaderboards/
[6] “Pastel de nata,” Wikipedia. https://en.wikipedia.org/wiki/Pastel_de_nata
[7] AWS Workshops, https://workshops.aws
[8] “Deutsche Fußball Liga Speeds Generative AI Adoption Supported by AWS,” AWS Case Study. https://aws.amazon.com/solutions/case-studies/dfl-generative-ai/
[9] “Bundesliga transforms data into AI-powered fan-favorite stories with AWS,” AWS Case Study. https://aws.amazon.com/solutions/case-studies/bundesliga-case-study/
About the Author
Stefan Christoph is a Principal Solutions Architect at AWS, focused on agentic AI, media & entertainment, and helping builders move from demo to production. He writes about AI architecture, developer productivity, and the future of software.
This is a personal blog. Opinions expressed here are my own and do not represent the views or positions of my employer.